Where will the S&P 500 Index go from here?
- Josh Pope

- Nov 10, 2022
- 3 min read
Updated: Nov 22, 2022
Wouldn't it be great as an investor to have confidence in understanding where the stock market was headed? Some internet speculators predict the market is way overvalued and is set to crash. Others predict new highs will be forthcoming. Who is to be believed? Let us see what mathematics reveal about stock market trends.
For this analysis, I will take a look at the king of passive index funds... the S&P 500 Index. The S&P is a proxy for the entire US stock market. To start, I pulled the weekly price data from Yahoo finance, which goes all the way back to 1927. The entire data set runs from 12/26/1927 to the latest week as I write this 11/7/2022. This is 95 years or 4,951 weeks of price data. Plotting the close value on a simple bar chart:
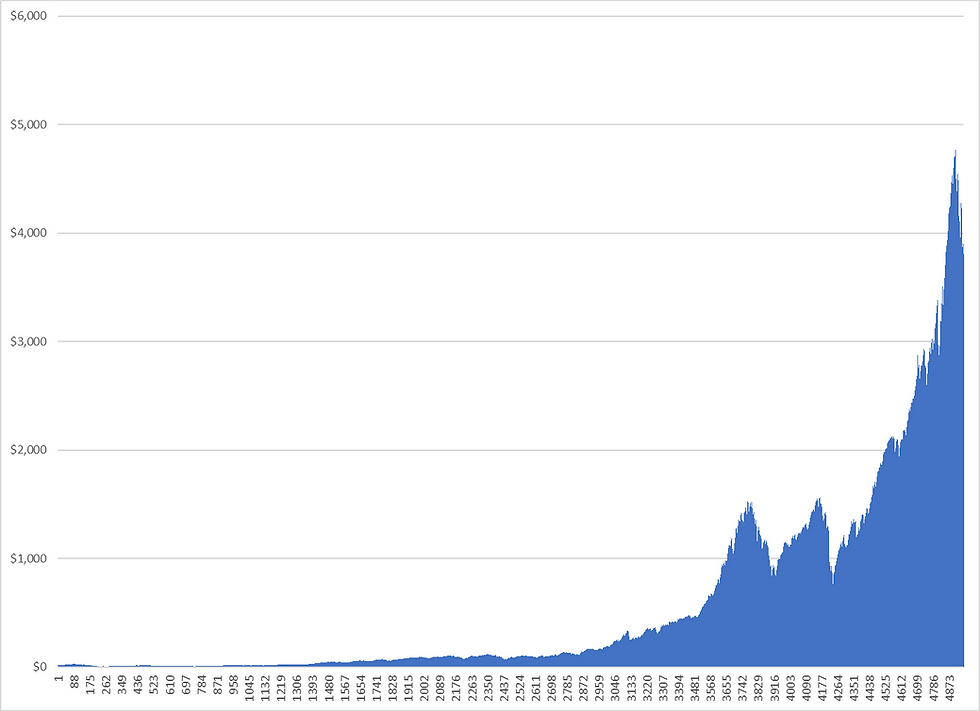
The Y-axis (left side) shows the $ value of the S&P 500 index for each week and the X-axis (bottom) is the week number starting from December 1927 through current. We can see that the S&P 500 price has increased substantially over time. In fact, it's quite clear by looking at it that the growth pattern is exponential. Adding an exponential trend line shows this:
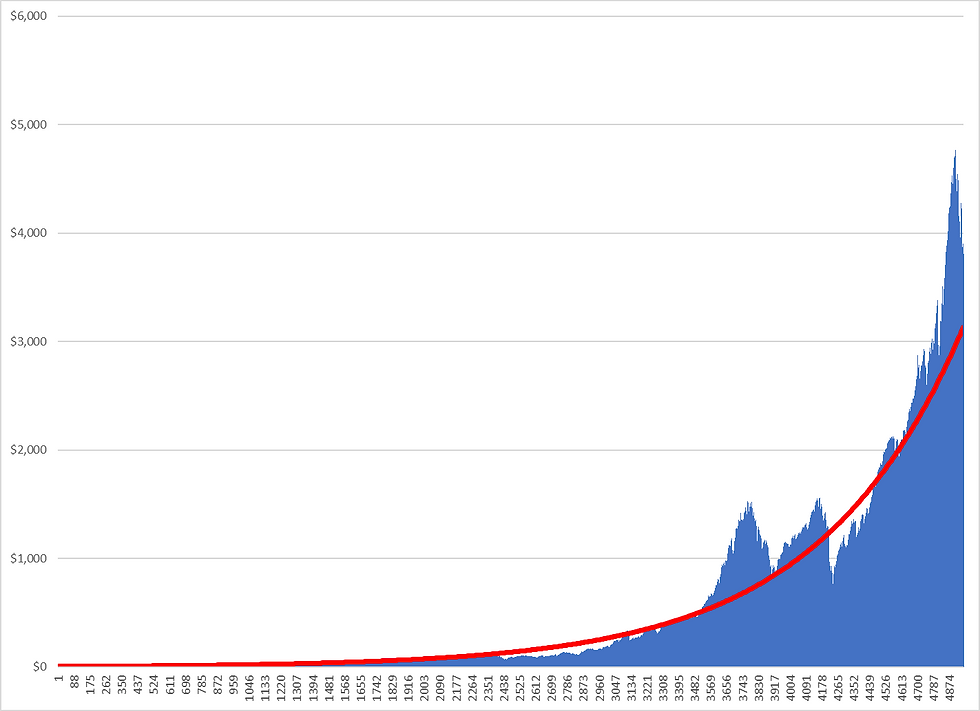
The red line is the "line of best fit" to the data. For more on trend lines and linear regression I will write a future post that delves into these concepts in more detail.
To make the trend a bit easier to work with, a log transformation can be applied to the weekly price data using the LN function in Microsoft Excel to convert the exponential trend to a linear trend. The red trend line is now a straight line rather than a curve:

The red box shows the formula and the R-Square value of the red linear trend line. The R-Square value tells us what percent of the variance in the S&P price data over time is explained by the trend line. This value ranges from 0 to 1. An R-Square of 0 would mean that the trend line does not fit the data at all and a value of 1 means the trend line fits the data perfectly. We can see here that the S&P 500 index very closely follows this trend line. In fact, the R-Square value is 0.96 which implies that 96% of the variance in the price of the S&P 500 index over the last 95 years can be explained simply by the passage of time alone (the week number). The remaining 4% of the variance is due to market fluctuations, speculation, bubbles, crashes, and all other market phenomena.
This finding is likely very surprising to the average stock market investor. The wild daily fluctuations in the S&P 500 Index can feel quite severe to a worried investor closely following the market. Per this linear regression, it turns out that the S&P 500 Index is largely predictable. The slope of the red line, in fact, is the average monthly growth rate of the S&P 5oo Index over the 95 years. 0.0013 per week X 52 weeks in a year is an average 6.76% annual return. Over the long term, investors in an S&P 500 Index fund should feel confident they will realize this average annual return. But what about the short term fluctuations that make up the 4% remaining variance? These can be scary and throw a lot of investors off their game. I will look at this more closely in the next post and beyond.
As an aside, mathematics can calculate and quantify trend lines and patterns like we see here but offers no insight into the drivers of the patterns. Why is it that over 95 years, the S&P 500 has an amazingly consistent and predictable growth? It seems with all of the wars, depressions, recessions, boom times, and financial crises that the S&P would be much more unpredictable.


Comments